
What is tag order?
Tag order tells the add-in how your table is laid out: which direction holds your line items (the financial concepts like Revenue or Total Assets) and which direction holds your time periods (2025, 2024, etc.).
Most financial tables have line items in rows and time periods in columns. But some — like a Statement of Changes in Equity — have a more complex structure with additional dimensions. You define this in the Tag Wizard so the add-in can correctly interpret every cell.
The Set Tag Order screen
After you select a defined name (named range) in the Tag Wizard, you arrive at the Set Tag Order screen. It has two sections:
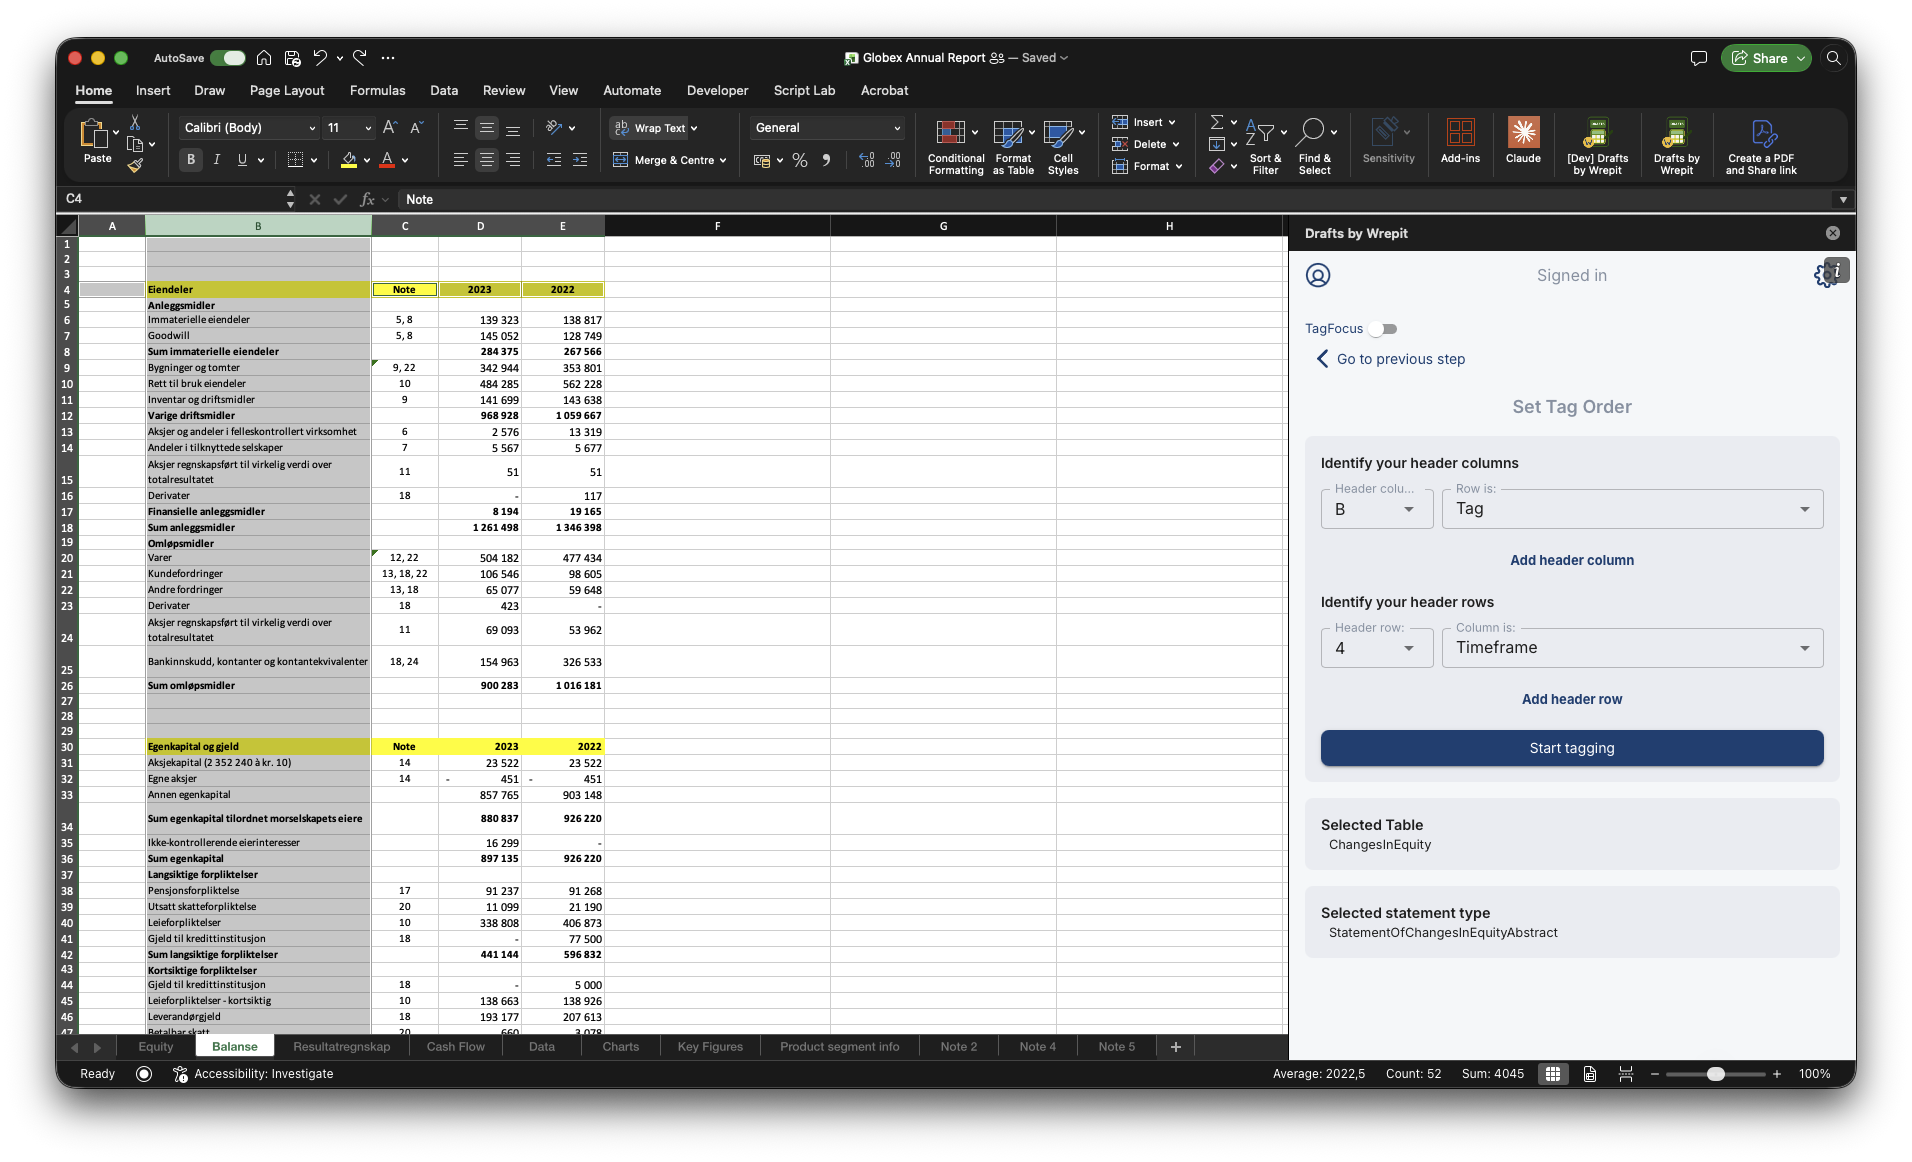
- Identify your header columns — tells the add-in which column contains your row headers, and what type of information they carry. A dropdown selects the column letter, and a second dropdown selects the dimension type.
- Identify your header rows — tells the add-in which row contains your column headers, and what type of information they carry. A dropdown selects the row number, and a second dropdown selects the dimension type.
The wizard pre-fills defaults based on the named range. In most cases, the defaults are correct and you only need to verify them. If your table has additional header rows or columns, click Add header row or Add header column to add more.
Dimension types
When you add a header row or header column in the Tag Wizard, you assign it one of four dimension types:
| Dimension type | What it means | Typical use |
| Tag | The financial concept labels (e.g., "Revenue", "Total Assets"). The add-in matches these to taxonomy concepts. | Row headers in most statements |
| Timeframe | The reporting period (e.g., "2025", "2024"). Can be an Instant (single date) or a Period (date range). | Column headers in most statements |
| Tag + Timeframe | A combined header that carries both the concept and the period on one axis. | Tables where a single row or column contains both tag and period info |
| Subtag | An additional dimension that breaks down a concept into components. Used for equity components, segments, or other breakdowns. | Column headers in Changes in Equity |
Rule: You can have at most one Tag dimension and one Timeframe dimension across all your header rows and columns combined. Tag + Timeframe counts as both.
Handling extra header rows
The add-in reads your named range to detect where the table starts. In many cases, the first row of your named range contains the column headers you need (like "2025" and "2024"), and setup is straightforward.
However, some tables have extra rows at the top that contain grouping labels the tagger does not need — for example, a row that says "Group" or "Consolidated" above the actual column headers.
How to handle this: In the Tag Wizard, set the header row number to the row that contains useful information (the year columns, for example), not the first row of the named range. The add-in will skip everything above it.
| Row | Content | Use in tagger? |
| Row 3 | "Group" | No — skip this row |
| Row 4 | "2025" / "2024" | Yes — set this as your Timeframe header row |
| Row 5 | "Revenue" (first data row) | Yes — this is where tagging starts |
In this case, you would set the header row to row 4 and the Tag column to the column that contains your line item labels (e.g., column A).
The same logic applies to columns — if there are extra columns with information the tagger does not need (like a "Notes" column), simply do not add them as header columns.
Standard financial statements
The Income Statement, Balance Sheet, Cash Flow Statement, and Statement of Comprehensive Income typically follow the same basic structure:
- Rows = line items → assign as Tag
- Columns = reporting periods → assign as Timeframe
The main difference between them is the timeframe type:
| Statement | Timeframe type | Why |
| Income Statement | Period (date range) | Revenue and expenses accumulate over time |
| Cash Flow Statement | Period (date range) | Cash flows accumulate over time |
| Comprehensive Income | Period (date range) | Income items accumulate over time |
| Balance Sheet | Instant (single date) | Assets, liabilities, and equity are measured at a point in time |
When you set time frames in Step 3 of the tagging process, you will select the matching variant (Instant or Period) for each column.
Statement of Changes in Equity
The Statement of Changes in Equity is structured differently from other financial statements. Instead of just line items and time periods, it has a third dimension: the equity components.
A typical equity table looks like this:
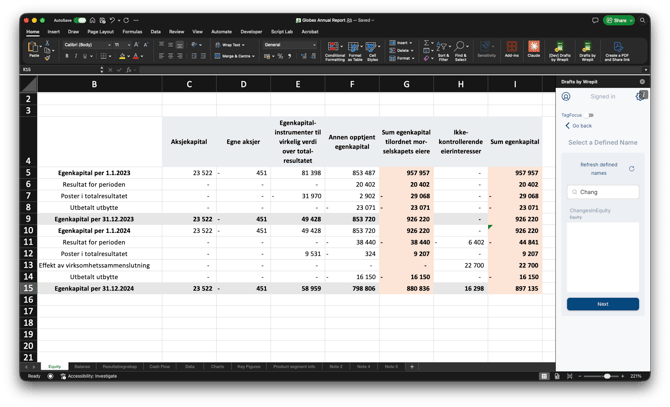
Notice that the row labels contain both the financial concept and the date (e.g., "Egenkapital per 1.1.2023"). The column headers are equity components, not time periods. This is where the Subtag dimension and the Tag + Timeframe combination come in.
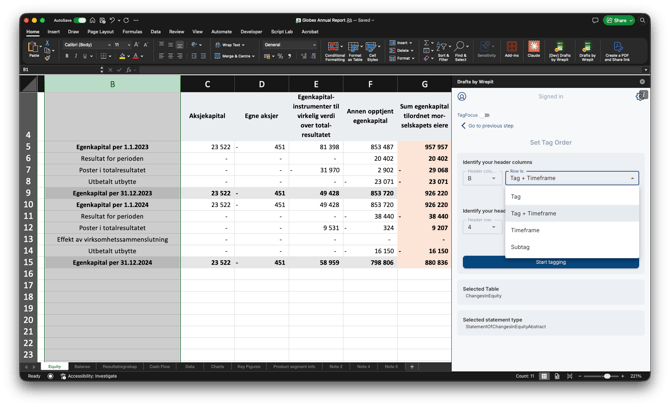
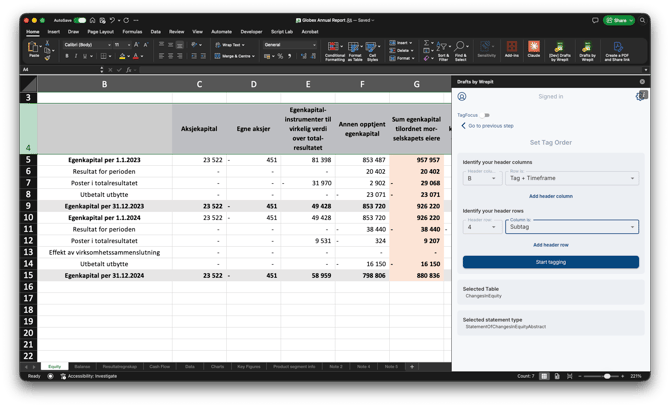
How the wizard is set up:
On the Set Tag Order screen, you will see:
- Header column: Column B set to Tag + Timeframe — because column B contains both the line item concept and the reporting date in one label.
- Header row: Row 4 set to Subtag — because row 4 contains the equity component names (Aksjekapital, Egne aksjer, etc.).
These defaults are typically pre-filled by the wizard. Verify that the column letter and row number are correct, and that the dimension types match. Then click Start tagging.
After completing the wizard, you tag each subtag column by selecting the appropriate dimension and member from the taxonomy (e.g., "Components of equity [axis]" → "Issued capital [member]"). The Sum egenkapital (Total equity) column has no subtag — set it to No subtag, because it represents the aggregate of all components.
Quick reference
| Statement | Header column | Header row | Notes |
|---|---|---|---|
| Income Statement | Tag | Timeframe (Period) | Standard setup |
| Balance Sheet | Tag | Timeframe (Instant) | Standard setup |
| Cash Flow Statement | Tag | Timeframe (Period) | Standard setup |
| Comprehensive Income | Tag | Timeframe (Period) | Standard setup |
| Changes in Equity | Tag | Subtag + Timeframe | Subtag columns for equity components |