---
title: Tag and Validate in Excel
description: Learn how to tag financial tables with XBRL concepts using the Drafts Excel add-in. Covers the Tag Wizard setup, tagging line items, calculations, extended tags, and validation.
---
[Skip to content](https://wrepit.net/help-center/tagging-and-validating-in-excel#main-content)
English - United States
Show submenu for translations

Open main navigation
Close main navigation
- English - United States
Show submenu for translations
- Contact us
Contact us
Hi, how can we help you?
- There are no suggestions because the search field is empty.
1. [Help Center](https://wrepit.net/help-center?hsLang=en-us)
2. [XBRL](https://wrepit.net/help-center/xbrl?hsLang=en-us)
3. [Tagging your report](https://wrepit.net/help-center/xbrl?hsLang=en-us#tagging-your-report)
# Tag and Validate in Excel
## Use the Drafts Excel add-in to tag financial tables with the correct XBRL concepts, define calculations, and validate your numbers before uploading.
### Before you start
- Your Excel file must be saved on SharePoint or OneDrive.
- Each table you want to tag must have a **defined name** in Excel. Select the table range, type a name in the Name Box (top left, next to the formula bar), and press Enter.
---
### Step 1: Open the add-in and select your taxonomy
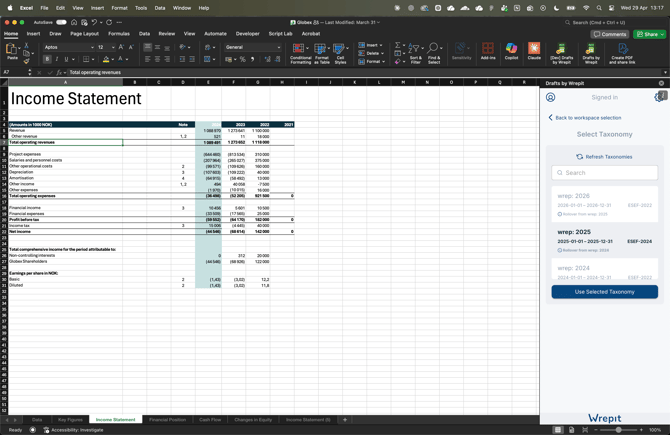
Open the Drafts add-in and sign in with your Microsoft account. Select the base taxonomy you created in the Portal. If you have not set one up yet, see **Setting Up Your Taxonomy in the Portal**.
### Step 2: Set up a table with the Tag Wizard
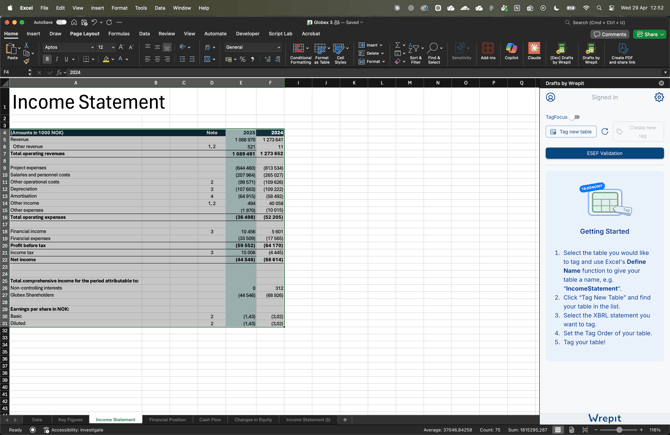
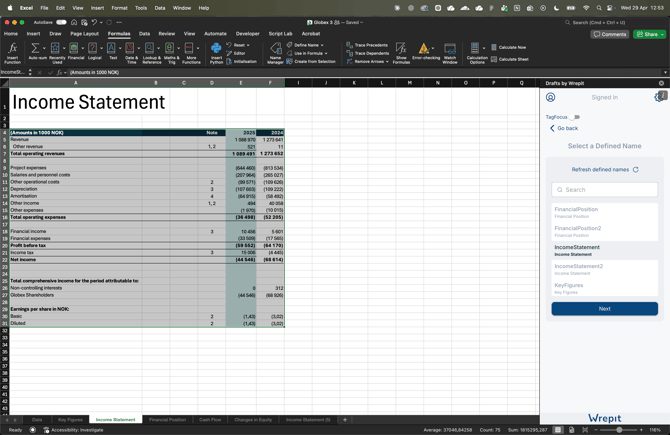
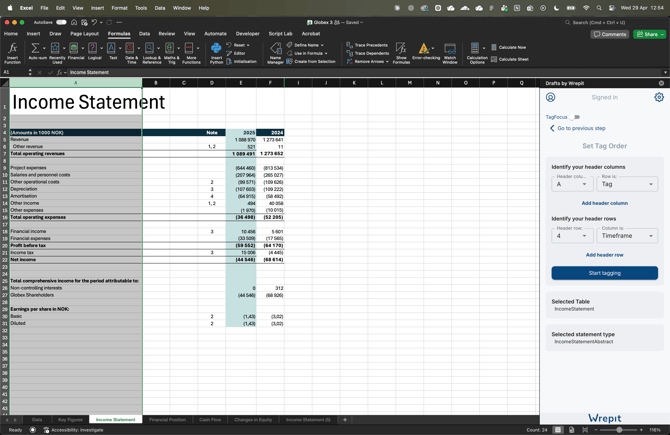
Click **Tag New Table**, select the named range you want to tag, and click **Submit**. The Tag Wizard will guide you through:
1. **Choosing the root statement** — Select the taxonomy statement that applies to this table (e.g., Income Statement, Balance Sheet).
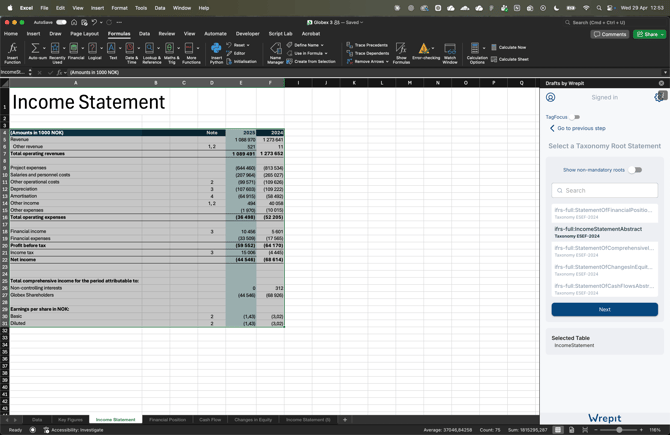
2. **Setting the tag order** — Tell the add-in whether rows or columns carry the line items and time frames.
1. **Defining header columns** — Specify what each column represents: **Tag** (the financial concept), a **Time Frame** (Instant or Period), or a **Subtag**.
2. **Defining header rows** — Specify what each row represents. Add multiple rows or columns if the table structure requires it.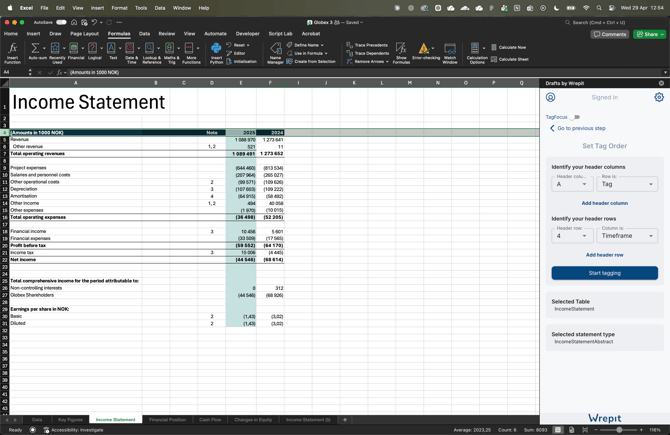
3. **Hiding irrelevant rows/columns** – On the final overview screen, hide any rows or columns that should not be tagged (e.g., note references, description columns).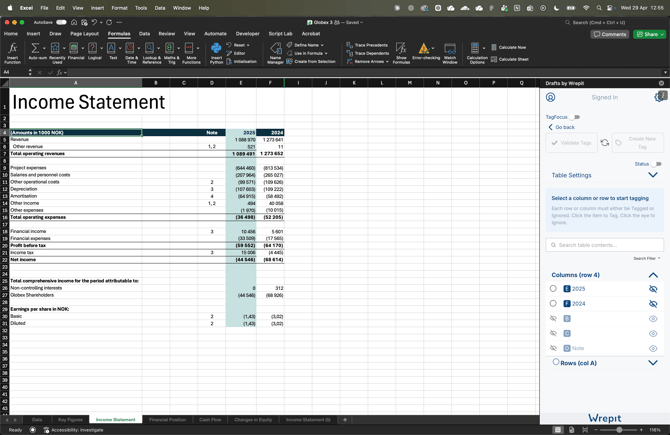
#### Understanding tag order and table structure
Tag order tells the add-in how your table is laid out — which rows and columns carry line items, time frames, and subtags. Most financial tables follow a standard setup, but some (like the Statement of Changes in Equity) require additional configuration such as subtag dimensions for equity components.
If your table has extra header rows that the tagger does not need (e.g., a row that says "Group" or "Consolidated" above the actual column headers), you can skip them by setting the header row to the row that contains useful information.
→ See [**Set up your table structure**](https://wrepit.net/help-center/understanding-tag-order?hsLang=en-us) for a full explanation of dimension types, handling extra header rows, and statement-specific setups.
---
### Step 3: Tag your table
With the Tag Wizard complete, you are ready to tag.
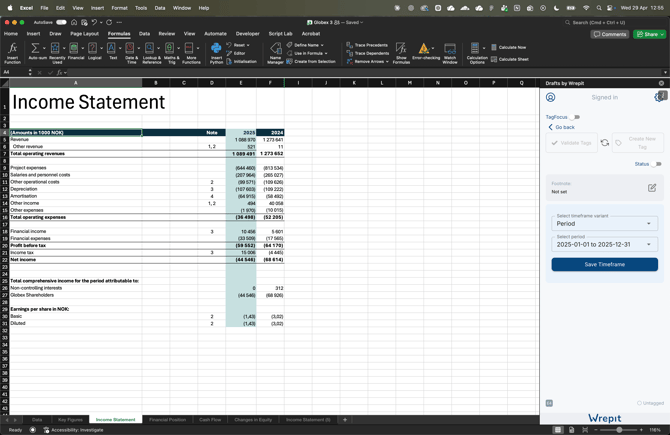
**Set time frames first:** Click a column header (e.g., "2024") and select the correct time frame variant. This applies to the whole column. Repeat for each period column.
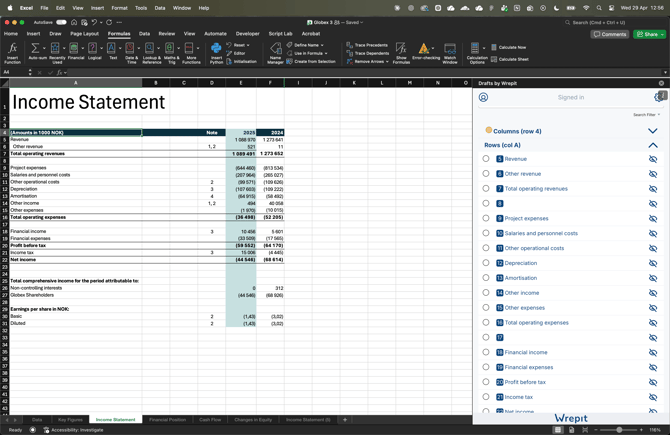
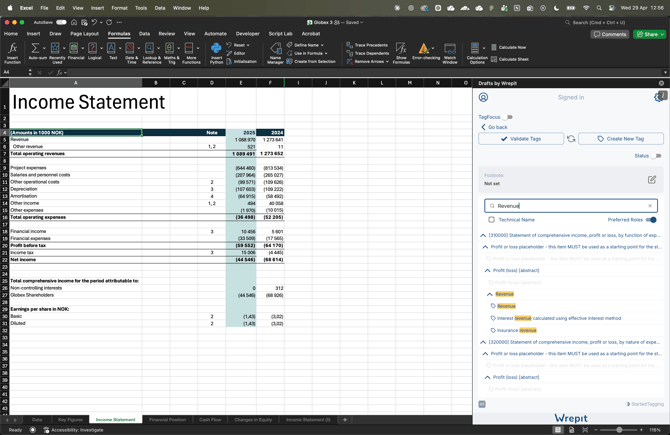
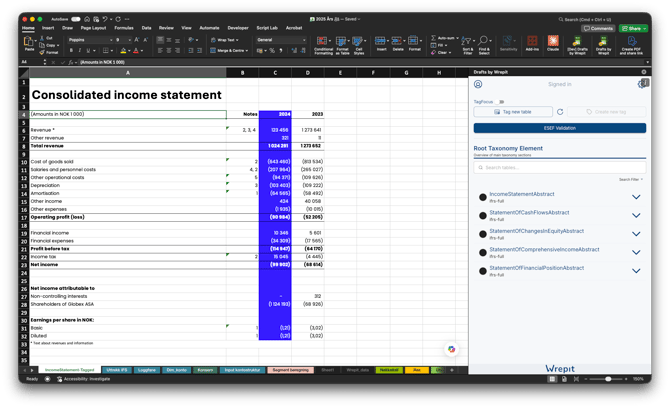
**Tag line items:** Enable the **TagFocus** toggle, then click a line item in your Excel sheet (e.g. A5). Use the search field to find the appropriate tag and click it. Click the **\[+\]** button to apply it. Move to the next row and repeat.
*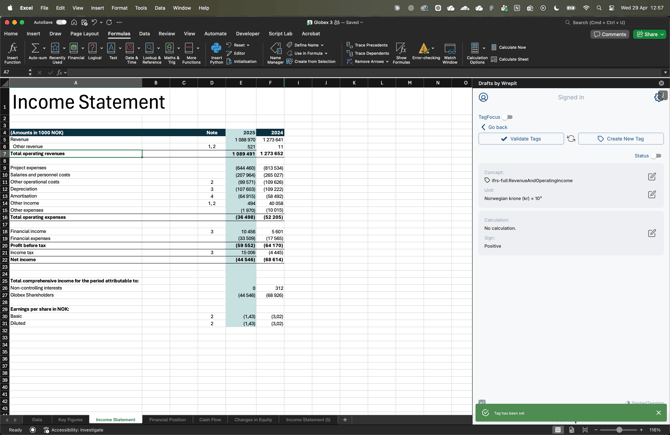*
If you cannot find the right tag, turn off the **Preferred roles** toggle to reveal tags from other taxonomy roots. You can favourite tags to keep them in your regular list — your selections are saved.
### Step 4: Handle calculations
For any total row, you need to define which cells it sums.
1. Click the total tag and then click **Edit** next to Calculations.
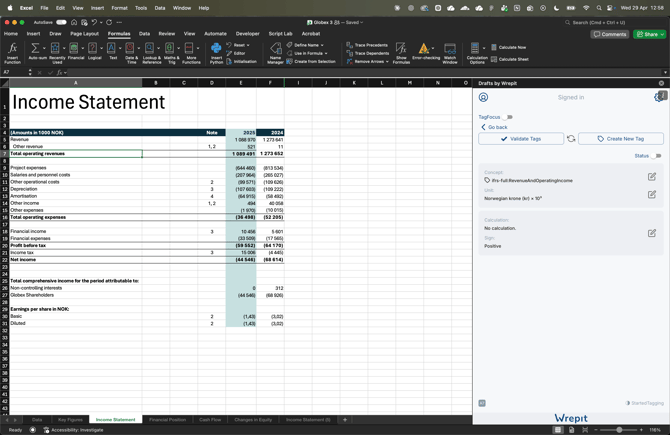
2. In the formula bar, type each cell that contributes to the total (e.g., D3+D4+D5), then click 'calculate'. You can also use the target icon  to select multiple cells by holding shift and clicking on each cell that contributes to the total.
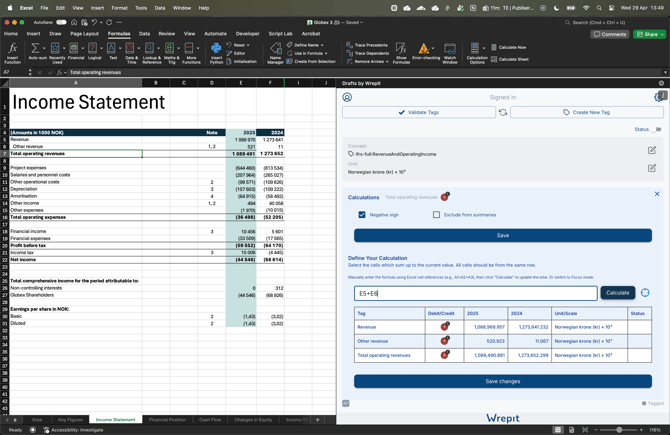
3. Save changes if calculation is correct or within the tolerance.
4. Rows that are not part of a calculation or a subtotal (e.g. shares) must be excluded from calculations. Do so by clicking on the row and check off on **Exclude from summaries** and save.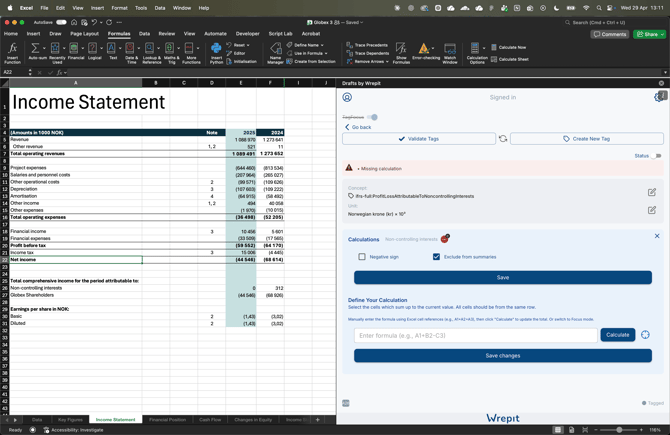
5. If all calculations are complete and correct the color indicators on each row will turn green
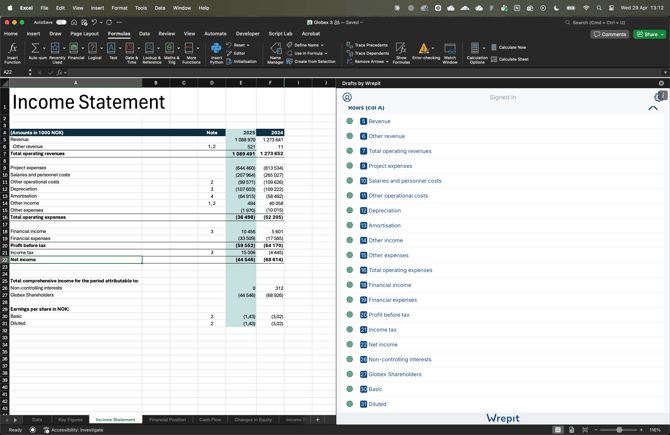
When selecting rows for a calculation, be careful with hidden rows. If you hold Shift to multi-select a range, hidden rows are included in the selection, this can produce incorrect calculations. Check for hidden rows in your range before clicking Set.
---
### Step 5: Create an extended tag (if needed)
If no existing tag fits a line item, you can create a company-specific extension concept directly in the add-in. Click the relevant row in the tagger — a **Create Tag** button appears. The form lets you set a wider anchor, define the concept properties, and add labels.
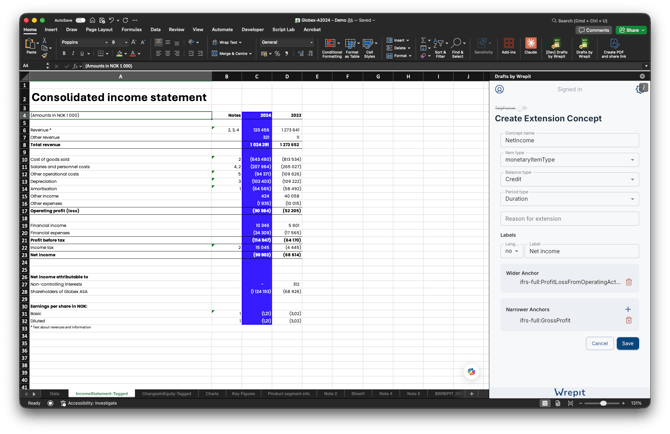
→ See **Create or edit extension concepts** for a detailed walkthrough of the form, anchors, and how to edit or delete extension concepts later.
### Step 6: Validate
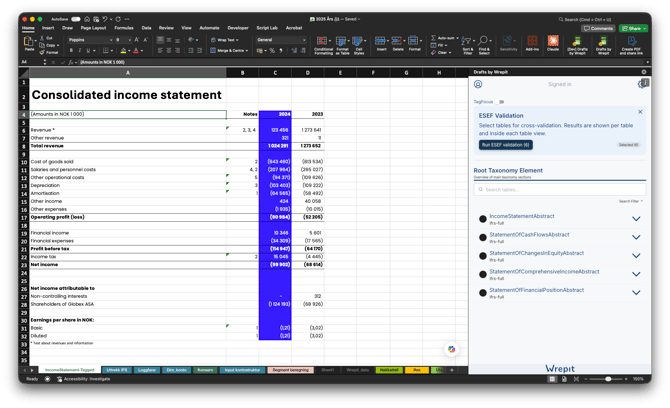
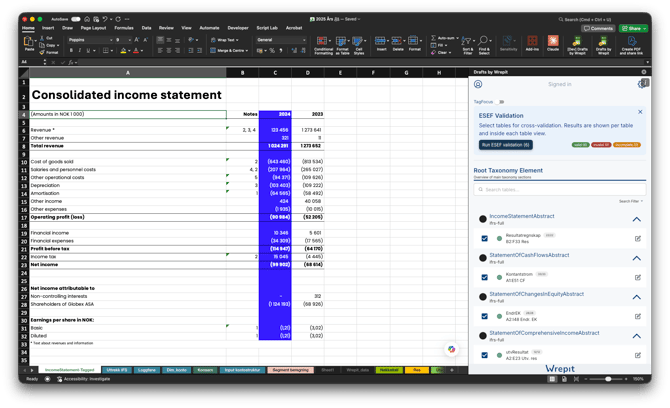
Click **Validate Tags** in the add-in. If errors are found, the add-in will show their count and location. Navigate to each flagged item, correct the tag or calculation, and click **Validate Tags** again. Repeat until all tags show green.
- [General](https://wrepit.net/help-center/general?hsLang=en-us#main-content)
- [Excel](https://wrepit.net/help-center/general?hsLang=en-us#excel)
- [PDF](https://wrepit.net/help-center/general?hsLang=en-us#pdf)
- [Word](https://wrepit.net/help-center/general?hsLang=en-us#word)
- [Reports](https://wrepit.net/help-center/reports?hsLang=en-us#main-content)
- [Document Setup](https://wrepit.net/help-center/reports?hsLang=en-us#document-setup)
- [Tables](https://wrepit.net/help-center/reports?hsLang=en-us#tables)
- [Publishing](https://wrepit.net/help-center/reports?hsLang=en-us#publishing)
- [Design Elements](https://wrepit.net/help-center/reports?hsLang=en-us#design-elements)
- [Export](https://wrepit.net/help-center/reports?hsLang=en-us#export)
- [XBRL](https://wrepit.net/help-center/xbrl?hsLang=en-us#main-content)
- [Setting up your taxonomy](https://wrepit.net/help-center/xbrl?hsLang=en-us#setting-up-your-taxonomy)
- [Tagging your report](https://wrepit.net/help-center/xbrl?hsLang=en-us#tagging-your-report)
- [Reference and troubleshooting](https://wrepit.net/help-center/xbrl?hsLang=en-us#reference-and-troubleshooting)
- [Account](https://wrepit.net/help-center/account?hsLang=en-us#main-content)
- [Access](https://wrepit.net/help-center/account?hsLang=en-us#access)
- [Users and Roles](https://wrepit.net/help-center/account?hsLang=en-us#users-and-roles)
- [Integrations and Add-ins](https://wrepit.net/help-center/integrations-and-add-ins?hsLang=en-us#main-content)
- [Excel2Word (Word add-in)](https://wrepit.net/help-center/integrations-and-add-ins?hsLang=en-us#excel2word-word-add-in)
- [Drafts (Word add-in)](https://wrepit.net/help-center/integrations-and-add-ins?hsLang=en-us#drafts-word-add-in)
- [Troubleshooting](https://wrepit.net/help-center/troubleshooting?hsLang=en-us#main-content)
- [Word](https://wrepit.net/help-center/troubleshooting?hsLang=en-us#word)
- [Drafts Word](https://wrepit.net/help-center/troubleshooting?hsLang=en-us#drafts-word)
- [Sign-in and access](https://wrepit.net/help-center/troubleshooting?hsLang=en-us#sign-in-and-access)
- [Drafts Excel](https://wrepit.net/help-center/troubleshooting?hsLang=en-us#drafts-excel)
- [Getting started](https://wrepit.net/help-center/getting-started?hsLang=en-us#main-content)
- [Getting started for new users](https://wrepit.net/help-center/getting-started?hsLang=en-us#getting-started-for-new-users)
[mailto:email@email.com](mailto:email@email.com)
Copyright © 2025, Wrepit