As our reporting platform evolves, we're committed to providing our users with the finest tools to enhance and simplify their financial reporting processes, and we're thrilled to unveil our latest innovation: The Grid Layout — a highly flexible tool that offers freedom and versatility for users looking to inject more creativity into their reports. Why dive into grid layout? Because it's your secret to crafting reports that don't just inform, but impress and engage.
Discover how it can take your reports to the next level, ensuring they are not only seen but also remembered.
Elevate Your Reports
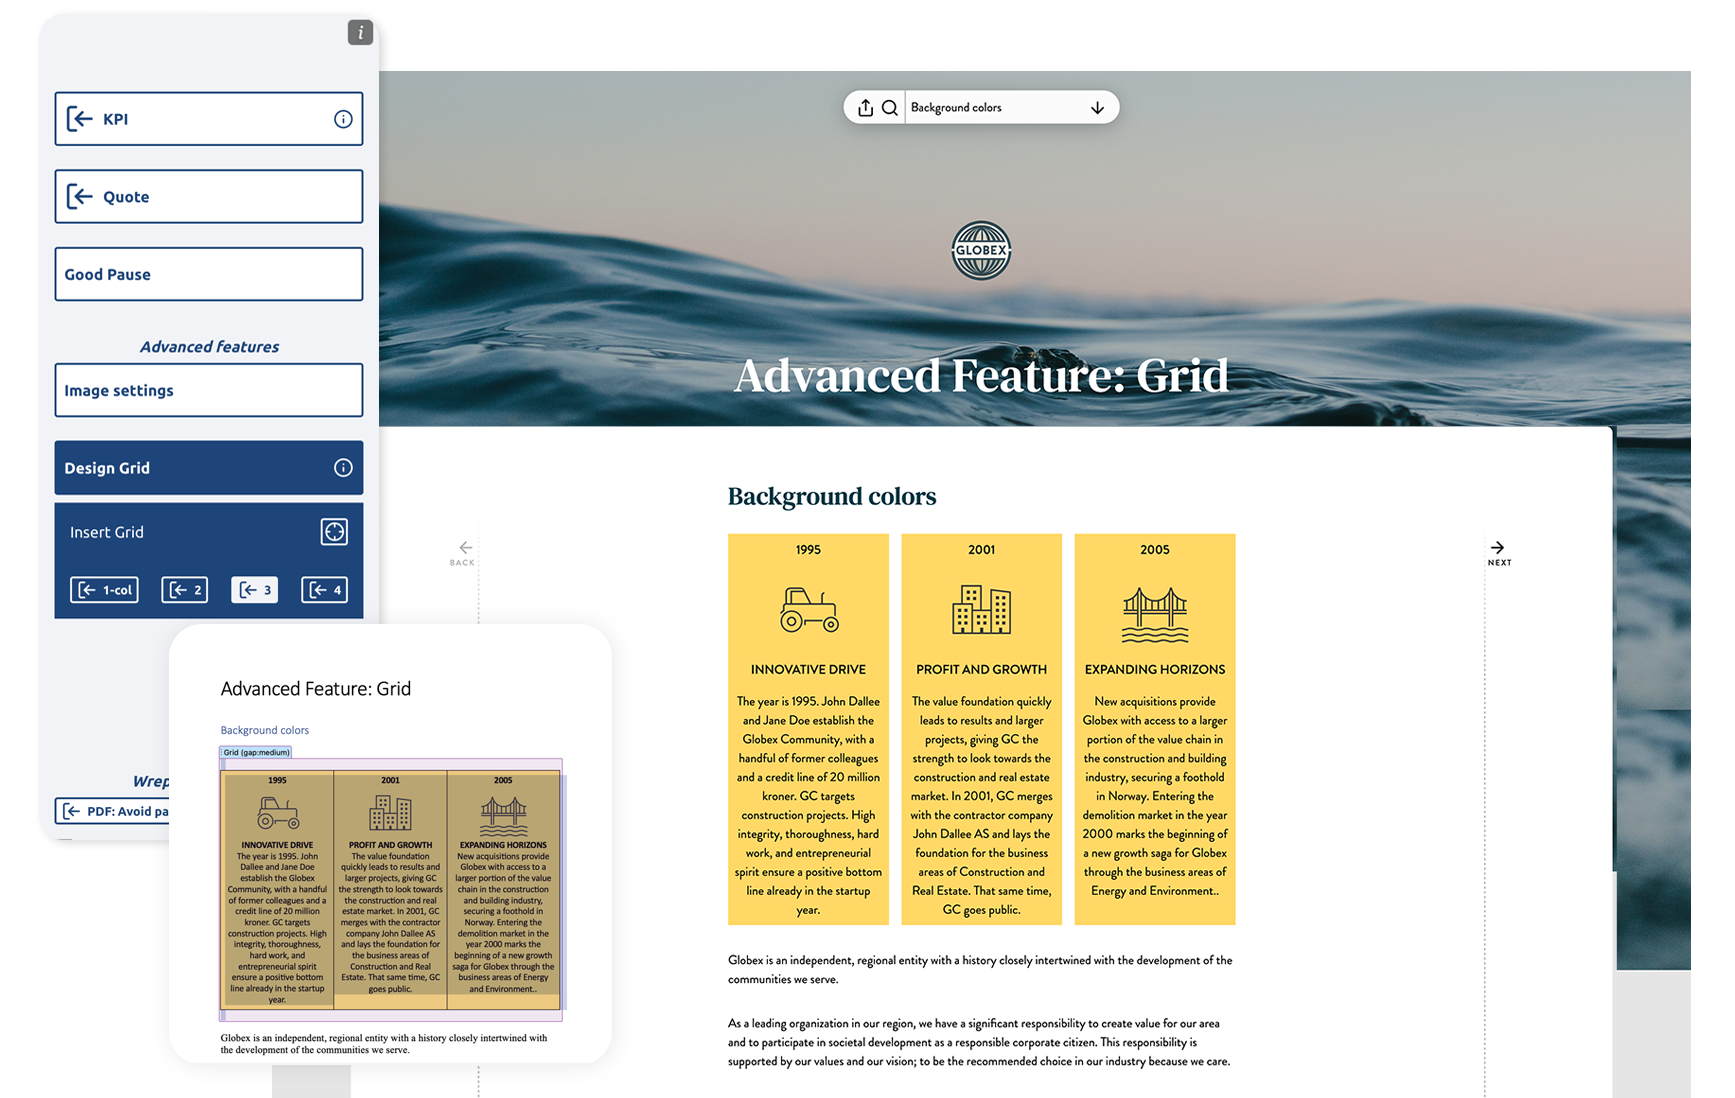
With the Grid Layout, you have the freedom to customize your reports to suit your specific needs and preferences. Whether you want to create a clean and minimalistic design or a vibrant and colorful layout, the Grid Layout can accommodate your vision.
The feature enables the side-by-side arrangement of design elements like KPIs, quotes, charts, graphs, tables, images and even body text. Furthermore, it allows for the customization of background colors, gap sizes, padding, and cell dimensions. Combined with your unique fonts and brand colors, it will help elevate your reports to the next level.
Tips for Maximizing the Grid Layout's Potential
We've compiled a handful of examples, accessible for download from our Resources, to easily integrate into your reports. However, if you decide to create your own grids from scratch, consider the following tips:
1. Experiment with visual elements: Don't be afraid to experiment with various visual elements. These can enhance the storytelling aspect of your reports and make them more engaging.
2. Utilize the built-in graphics in MS Word: If you don't have custom icons or illustrations for your reports, use the wide range of stock images available in MS Word's library. You can even customize the colors of the illustrations to align with your brand's color palette.
3. Stack elements within cells: You are not confined to only inserting one element into one cell. Experiment with stacking to keep your design elements neatly organised within the grid and elevate the visual appeal of your reports.
4. Embrace the power of alignment: Within the Grid Layout, you have the freedom to experiment with alignment, allowing you to create visually dynamic layouts that truly stand out.
5. Showcase visuals easily: Elevate your reports by incorporating images. Utilize the Grid Layout to seamlessly insert and customize images, creating visually appealing galleries or personal showcases highlighting individuals within your organization.
By following these tips, you can unlock the true potential of the Grid Layout and create reports that are both visually stunning and highly effective.
Discover more about Grid Layout in our detailed guide, or draw inspiration from a selection of excellent templates that can be effortlessly adapted and personalized to blend into your report seamlessly.